IMPROVE MY GAME
Articles
The Linear Kinematic Sequence
It is known that there is an efficient sequence of motion in a skilled golf swing called the Kinematic Sequence. It describes the proximal-to-distal sequencing of the rotation speeds of the body segments. Each body segment; pelvis, ribcage and arm sequentially accelerates and decelerates before impact, starting from the inner large body segments; the pelvis and ribcage, then progressing to the smaller outer segments; the arms, hands and club. Each successive segment peaks faster and later than the previous segment. This action causes the club to accelerate rapidly and reach its highest speed at impact. Figure 1 shows the graph of the rotational Kinematic Sequence of a world class golfer and includes images of his position at each peak speed point in the downswing.

It is also known that the golf swing is not only rotational; it has a linear component of motion as well. Therefore it would make sense that there is also a linear kinematic sequence during the downswing, and in fact there is. Figure 2 shows the linear Kinematic Sequence graph of a world class golfer. It shows the linear speed of his lead hip, lead shoulder, mid-hands and club head.
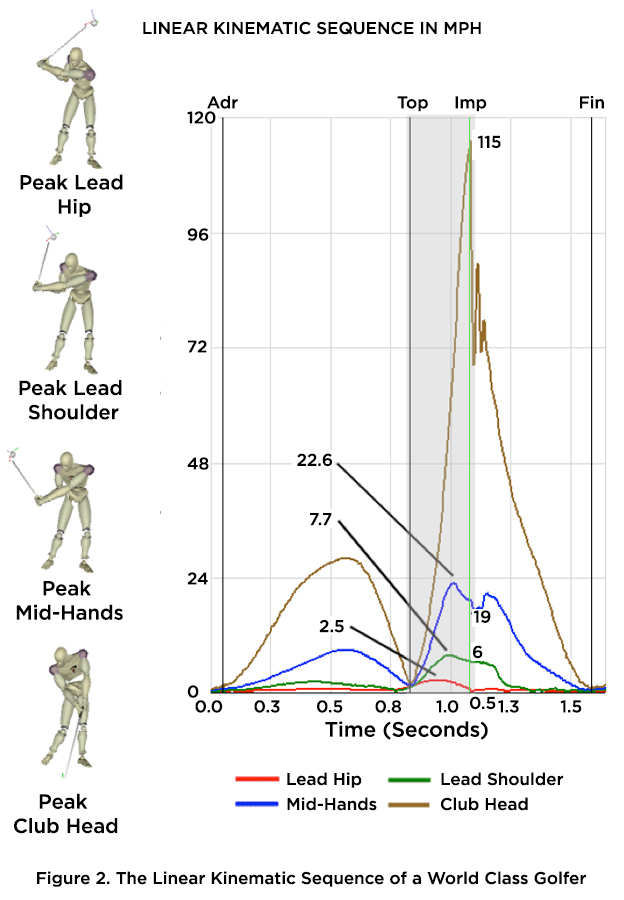
Look in the shaded gray area of Figure 2 and notice how, during the downswing, the lead hip accelerates (goes up) and reaches its peak speed first, then decelerates (goes down), followed by the lead shoulder, the mid-hands and finally the club. Notice that these accelerations and decelerations are all before impact and that the only segment that doesn’t decelerate prior to impact is the club head. As we would expect, the club head accelerates during the downswing and reaches max speed at impact. Notice that each successive peak speed occurs later in the downswing than the previous one and is faster than the previous one.
In fact, it is not as important what the speeds of the joints are at impact but what their maximum speeds are earlier in the downswing. We expect their speeds at impact to be lower because of the deceleration phase of each joint as it passes energy to the next segment - each joint is slowed down by the interaction force of the next segment accelerating against it. Take for example the mid-hands curve. You see that its highest speed is 22.6 mph and its speed at impact is 19 mph. For the mid-hands curve, the deceleration is related to the explosiveness of the release. The faster the release of the wrists the more the deceleration and the slower the hands will be at impact. It is a nice example of the action-reaction law of motion; the force of the club releasing causes and opposite force on the hands causing the lead arm to slow down. This means that measuring hand speed at impact may be misleading. It’s better to know what the peak hand speed was earlier in the downswing. From our research at TPI we have compiled a tour pro database and from this database, we have found that the average peak mid-hands speed in the downswing is 22.0 mph and the average mid-hands speed at impact is 17.6 mph.
© Phil Cheetham
The 3D Guy